Michaelis-Menten Plot
Import from Excel
Copy two columns ([S] and v₀) from Excel or Google Sheets and paste them here:
Title
Message
Was this tool helpful?
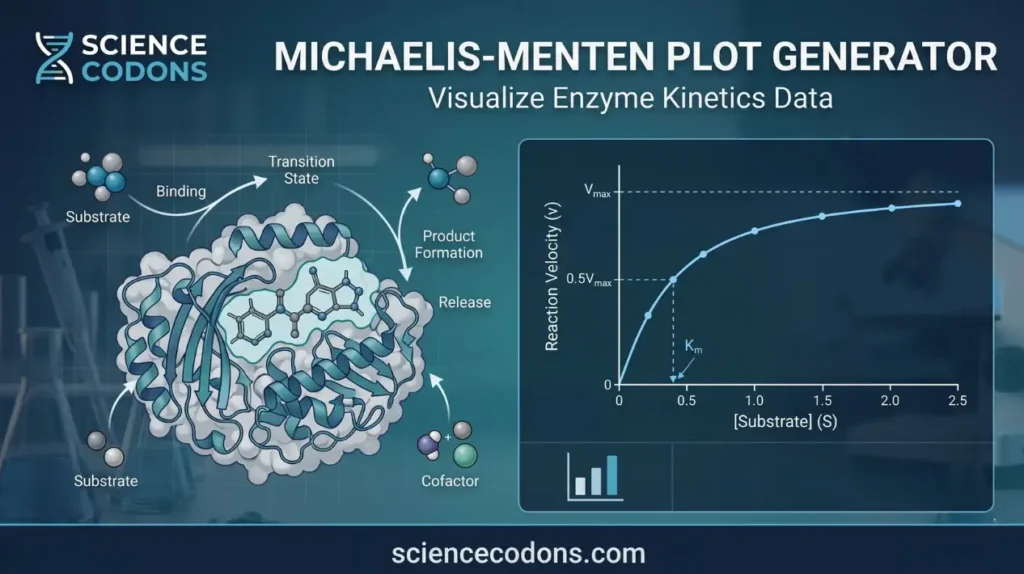
The Michaelis-Menten Plot Generator is an online tool for plotting and analyzing enzyme kinetics using the standard saturation model. It shows the relationship between substrate concentration and reaction rate, making it easier for researchers and students to calculate and study key values such as Km and Vmax with clear visuals. With this tool, you can enter your lab data, such as substrate concentrations and starting reaction rates, to automatically create a Michaelis-Menten curve. This makes analyzing enzyme kinetics faster and easier, so you can study enzyme saturation under different conditions more thoroughly.
How to Use the Generator
- Select Input Mode: Choose between Data Points to enter raw experimental measurements or Parameters to plot theoretical curves using known Vmax and Km values.
- Define Curve: Enter an experiment name and select a custom color. If you are comparing different conditions, use the New Curve button to create overlapping datasets on the same axis.
- Populate Data: Input substrate concentrations [S] and initial velocities v0 into the interactive grid, or use the Bulk Import feature to paste columns directly from Excel or Google Sheets.
- Synthesize & Analyze: The tool automatically calculates the best-fit hyperbolic curve, R-squared value, and kinetic constants in real-time.
- Export Results: Use the output tools to download your graph as a High-Resolution (6x) image suitable for publication or academic presentations.
Meet the Authors

Mahdi Morshedi Yekta
Founder & Bioinformatics Developer
Mahdi is the founder of ScienceCodons and a Medical Biotechnologist with a deep passion for computational biology. Holding an M.Sc. in Medical Biotechnology, he specializes in transforming complex biological algorithms into accessible, high-performance web tools, bridging the gap between laboratory sciences and software engineering.

Fatemeh Faryadras
Medical Biotechnologist & Researcher
Fatemeh is a Medical Biotechnologist and researcher. With extensive expertise in genetic engineering, molecular cloning, and cancer biology, she combines her rigorous laboratory background with intuitive design principles to create reliable, user-centered scientific calculators and tools.

Dr. Mosayeb Rostamian
Assistant Professor, Infectious Diseases Research Center
Certified Scientific Reviewer
Google ScholarExpert Review Process
To ensure the highest quality and scientific accuracy, this tool's underlying algorithms, formulas, and edge-case handling have been thoroughly reviewed and validated by Dr. Mosayeb Rostamian.
The "Reviewed By" badge signifies that an independent expert has evaluated the tool's logic to guarantee accuracy and alignment with the current consensus in the scientific community.