PDBQT Structure Viewer
To get started, load your data using the Import Data button below. Once your structure is loaded, you can control the visualization using the “Tools Panel”.
Was this tool helpful?
The PDBQT File Viewer is a web-based tool that helps you view and interpret .pdbqt files accurately. You can use it to prepare receptors for docking or to study how drug candidates bind. The tool works right in your browser, so you do not need to install any extra software. You can quickly check atomic charges, atom types, and the structure in an interactive 3D view.
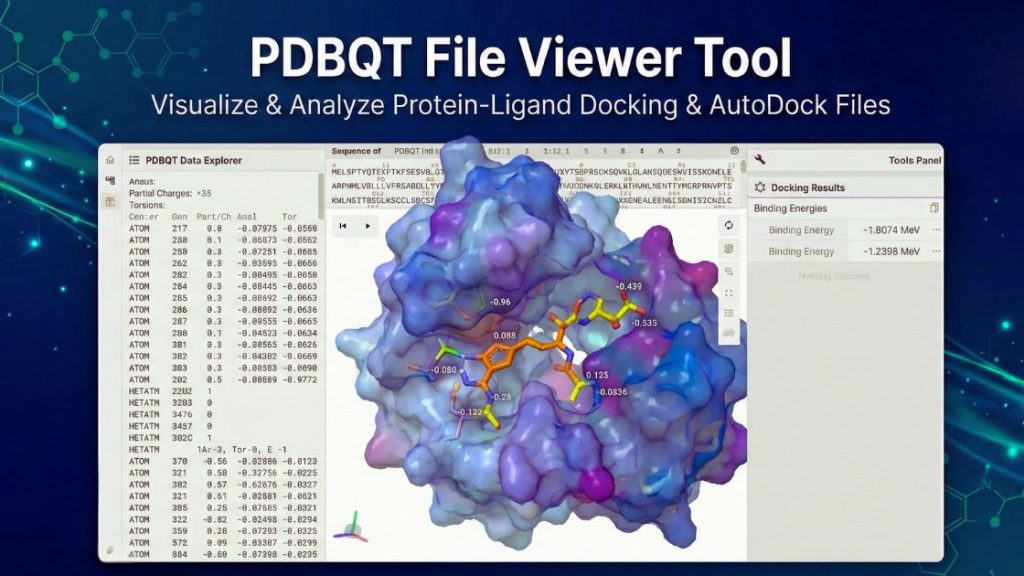
PDBQT stands for Protein Data Bank + Charge (Q) + Type (T). It is a modified version of the standard PDB format, mainly used by the AutoDock suite. Unlike a standard PDB file, a PDBQT file includes two key pieces of information for every atom: partial charge and AutoDock atom type. These parameters are vital for calculating interaction energies during docking simulations. Researchers use this format extensively in computer-aided drug design to define both the macromolecule (receptor) and the small molecule (ligand).
Do you need to create a PDBQT file? If you have a standard PDB structure and want to prepare it for docking or visualization, you can easily convert it with our PDB to PDBQT Converter.
Quick Start Guide
Our interface is designed for efficiency. Follow these steps to fully utilize the viewer:
A) Loading a Structure
You have several ways to load your chemical data:
- Upload Your Files: Click the Select files… button and choose the .pdbqt (or other structure) file(s) from your computer. You can manually select the file format (Format) or leave it on Auto for automatic detection. After selecting, click the Apply button.
- Import from Databases: Expand this section if you wish to fetch structures from supported public repositories. Enter the identifier and press Apply.
- Load from URL: Enter the direct URL of a remote file in this section and press Apply.
B) Interacting with the Viewport
- Rotate: Click and drag the left mouse button (or one finger on mobile) to rotate the molecule.
- Zoom: Use the mouse scroll wheel (or pinch with two fingers on mobile) to inspect bond details or zoom out to see the whole lattice.
- Pan: Click and drag the right mouse button (or drag with two fingers on mobile).
- Select: Click on an atom to highlight it. You can select multiple atoms by holding the Shift key.
- Focus: After selecting an atom or group, use the magnifying glass icon in the Tools Panel to center the view on it.
C) Using the Tools Panel
In the right panel (Tools Panel), you can customize the visualization:
- Structure: Manage loaded models. Toggle visibility for different parts of a complex system.
- Measurements: To measure bond lengths or angles, click + Add. Select the type (e.g., Distance for bonds, Angle for geometry), then click on the specific atoms in the 3D viewport to display the value.
- Quick Styles: Instantly change how the molecule is rendered. Common styles include Ball & Stick (ideal for seeing bonds), Spacefill (for volume), or Surface (for shape).
- Components: For advanced control. Define specific representations for different parts of the molecule (e.g., show the solvent as ‘Spacefill’ and the solute as ‘Ball & Stick’).
D) Saving & Exporting
- Save Screenshot: Capture high-resolution images of your molecules for reports or presentations using the camera icon (📸).
- Save Session: Use the save disk icon (💾) to export a session file. This allows you to reopen the viewer later with the exact same orientation, measurements, and visual settings.
The Logic
Displaying a PDBQT file requires a specialized rendering pipeline that translates specific alphanumeric data into a graphical object. Here is how our engine handles your file:
1. The Parsing Phase
When a file is loaded, the application acts as a specialized parser. It reads the file line-by-line, identifying standard coordinate records (ATOM and HETATM). Crucially, the parser looks beyond the standard X, Y, Z coordinates. It extracts the Charge (Q) and Atom Type (T) values found in the final columns of the data structure. This ensures that the chemical properties specific to the docking format are preserved in the memory model.
2. Topology and Bonding
Unlike standard formats that might explicitly list every bond, PDBQT files often rely on distance-based heuristics or internal topology definitions. Our engine calculates atom connectivity based on the parsed atomic coordinates and the specific “Atom Types” defined in the file. It determines bond orders and draws the appropriate cylinder geometries between atomic spheres.
3. GPU-Accelerated Rendering
Once the geometry is constructed, the data is passed to a WebGL context. This leverages your computer’s Graphics Processing Unit (GPU) to render lighting, depth, and materials. By utilizing hardware acceleration, the viewer can smoothly handle large receptor macromolecules alongside complex ligand poses without performance lag, providing a seamless “in-browser” experience that rivals native desktop applications.
FAQ
Reference
- Sehnal, D., Bittrich, S., Deshpande, M., Svobodová, R., Berka, K., Bazgier, V., Velankar, S., Burley, S. K., Koča, J., & Rose, A. S. (2021). Mol* Viewer: modern web app for 3D visualization and analysis of large biomolecular structures. Nucleic Acids Research, 49(W1), W431–W437. https://doi.org/10.1093/nar/gkab314
Meet the Authors

Mahdi Morshedi Yekta
Founder & Bioinformatics Developer
Mahdi is the founder of ScienceCodons and a Medical Biotechnologist with a deep passion for computational biology. Holding an M.Sc. in Medical Biotechnology, he specializes in transforming complex biological algorithms into accessible, high-performance web tools, bridging the gap between laboratory sciences and software engineering.

Fatemeh Faryadras
Medical Biotechnologist & Researcher
Fatemeh is a Medical Biotechnologist and researcher. With extensive expertise in genetic engineering, molecular cloning, and cancer biology, she combines her rigorous laboratory background with intuitive design principles to create reliable, user-centered scientific calculators and tools.

Dr. Mosayeb Rostamian
Assistant Professor, Infectious Diseases Research Center
Certified Scientific Reviewer
Google ScholarExpert Review Process
To ensure the highest quality and scientific accuracy, this tool's underlying algorithms, formulas, and edge-case handling have been thoroughly reviewed and validated by Dr. Mosayeb Rostamian.
The "Reviewed By" badge signifies that an independent expert has evaluated the tool's logic to guarantee accuracy and alignment with the current consensus in the scientific community.