Pancreatic cancer originates in the pancreas, a gland that supports digestion and the regulation of blood sugar, and it may arise from either its enzyme-producing or its hormone-producing cells. Advancing age, tobacco use, long-standing diabetes, chronic pancreatic inflammation, and a family history of the disease are established risk factors, and the cancer remains a notable public-health concern across the United States. Alaska reports data by borough and census area rather than by county, and national cancer surveillance data from the National Cancer Institute and the Centers for Disease Control and Prevention show estimates of new cases ranging from 6.8 to 16.4 per 100,000 people per year over the recent 5-year period. The statewide rate is displayed on the interactive map. All rates are age-adjusted to the 2000 U.S. standard population, which applies one common age structure to every area so that places with older or younger residents can be compared fairly.
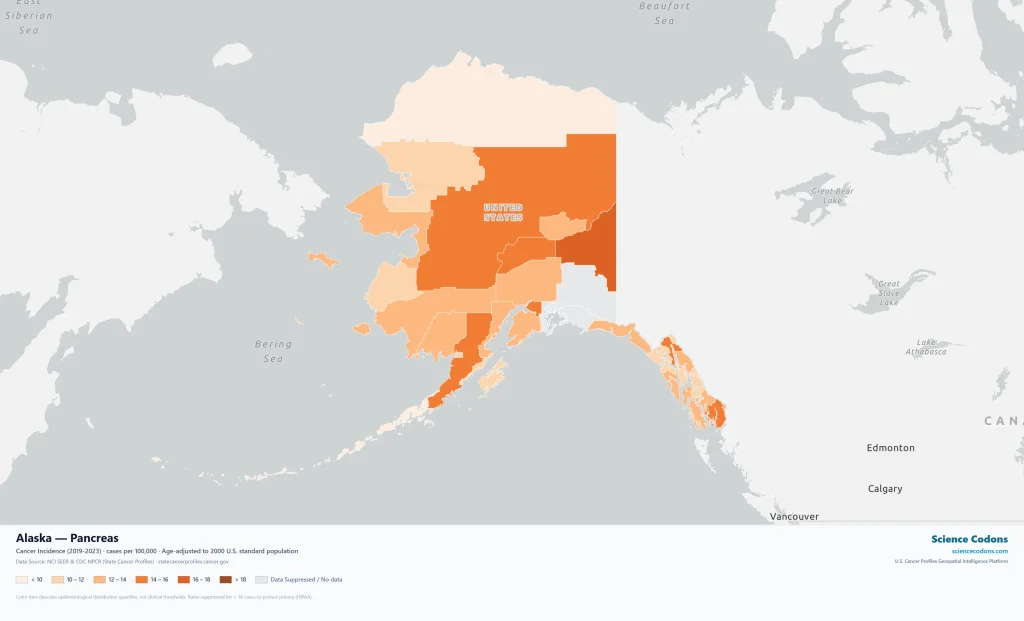
Alaska Pancreatic Cancer Rates
The national age-adjusted incidence rate of pancreatic cancer over the recent 5-year period is 13.5 new cases per 100,000 people per year, with a 95% confidence interval of 13.4 to 13.6. A confidence interval is the range within which the true rate is likely to lie, and a narrower interval indicates a more precise estimate. A difference from the national rate is described as statistically significant only when an area’s interval excludes 13.5.
The statewide Alaska rate and its interval are shown on the interactive map. Among the 28 boroughs and census areas with reportable rates, the median of area estimates is 13.2 per 100,000 people, close to the national figure. Four areas have rates statistically significantly higher than the national rate, and 11 have rates statistically significantly lower. The remaining 13 are not statistically different from it. Rates for two additional areas are suppressed.
Geographic Variation in Pancreatic Cancer Rates on the Alaska County Map
Alaska shows a wide spread between its lowest and highest estimates, about ten rate points, which is greater than in many states. The 95% confidence intervals around individual area rates are generally about two points wide, so modest differences between neighboring boroughs and census areas should not be interpreted as meaningful. Estimates for sparsely populated areas are typically less stable, and this page does not rank individual areas. Each area’s rate and interval can be viewed by selecting it on the interactive map.
No consistent rural-urban pattern is evident. Only three areas are classified as urban, and their estimates, between 13.7 and 14.1, fall within the much broader range of the 25 rural-classified areas, which runs from 6.8 to 16.4. Variation between areas should be read as a description of populations rather than of individual risk, and it cannot be attributed to specific causes using these data.
Recent Five-Year Pancreatic Cancer Trends in Alaska
Joinpoint regression applied to the recent 5-year period classifies each area’s incidence trend as rising, falling, or stable. A stable classification means that no statistically significant change was detected, not necessarily that rates are unchanged. Among the 28 areas with reportable rates, 20 are classified as stable, 3 as falling, and 2 as rising, and a trend is unavailable for 3.
The national trend is classified as rising (0.8 percent), whereas most Alaska areas show no statistically significant change. Trend classifications in areas with small populations rest on limited data and warrant cautious interpretation. The statewide trend classification is available on the interactive map, which allows readers to review each area’s rate, interval, and trend in one place.
FAQ
What is the pancreatic cancer incidence rate in Alaska?
Age-adjusted incidence rates across Alaska’s boroughs and census areas range from 6.8 to 16.4 new cases per 100,000 people per year, with a median of area estimates of 13.2. The statewide rate and its 95% confidence interval are displayed on the interactive map alongside the national rate of 13.5. All rates are age-adjusted to the 2000 U.S. standard population.
Which boroughs and census areas in Alaska have the highest and lowest pancreatic cancer incidence rates?
Area estimates extend from 6.8 to 16.4 new cases per 100,000 people per year, and both rural-classified and urban-classified areas fall within the middle of that range. Because estimates for sparsely populated areas are less stable, this page does not rank individual areas. The interactive map shows every borough and census area’s rate and confidence interval.
Are pancreatic cancer incidence rates rising or falling in Alaska?
Most Alaska boroughs and census areas show a stable trend: of 28 areas with reportable rates, 20 are stable, 3 are falling, and 2 are rising. The statewide trend classification is displayed on the interactive map. Nationally, the trend is classified as rising.
This article was reviewed for scientific accuracy by Dr. Mosayeb Rostamian. The content is based on current evidence in epidemiology and infectious diseases and is intended for educational purposes only. It does not constitute medical advice and should not be used as a substitute for professional health consultation.