
CDC PLACES
U.S. counties
Obesity among adults
Crude and age-adjusted prevalence
About This Interactive Obesity Map
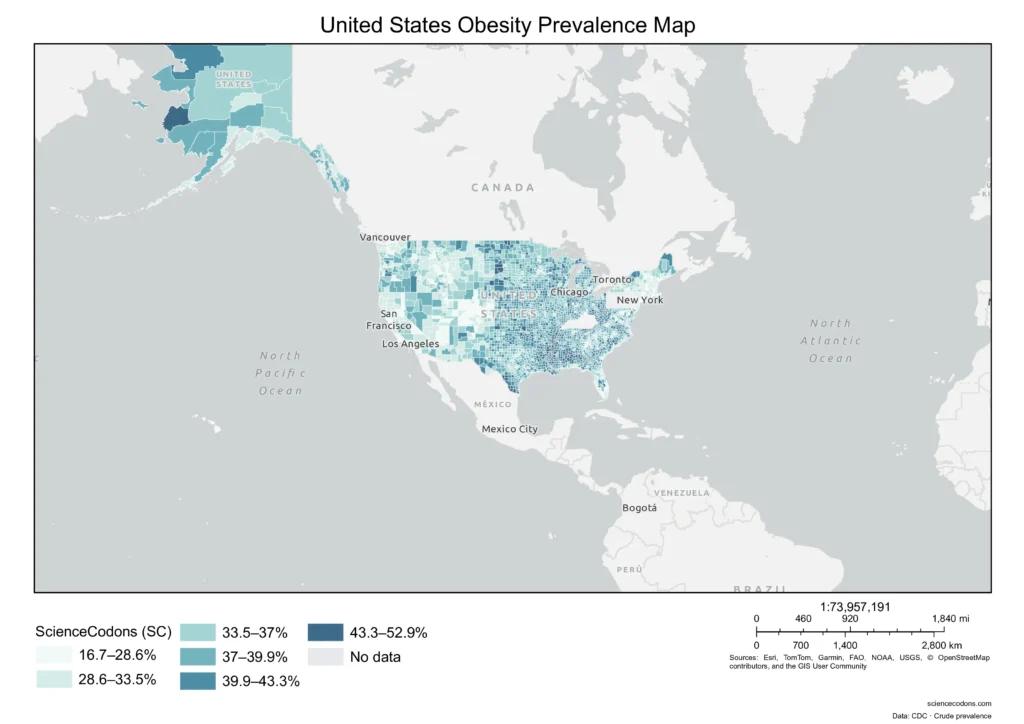
This interactive choropleth map visualizes estimated adult obesity prevalence by county across the United States. Each county is colored according to its prevalence estimate. Darker or higher-class colors represent counties with higher estimated prevalence, based on the classification ranges shown in the map legend.
Hover over or select a county to view its local prevalence estimate and 95% confidence interval. You can also filter the map by state to see a more detailed view of counties within a selected geographic area. The map includes tools for:
- exploring individual counties
- filtering counties by state
- searching for locations
- switching between crude and age-adjusted prevalence
- zooming and navigating the map
- changing the basemap
- viewing the map in fullscreen mode
- exporting the visualization or underlying data
How to Read the Data
CDC PLACES defines adult obesity using body mass index (BMI). For this measure, obesity is defined as a BMI of 30.0 kg/m² or higher among adults aged 18 years or older. BMI is calculated using self-reported height and weight in the Behavioral Risk Factor Surveillance System (BRFSS). A county prevalence estimate of 35%, for example, means that the model estimates that approximately 35% of the adult population represented by the measure meets the definition of obesity. These estimates describe populations, not individual people.
Crude Prevalence
Crude prevalence represents the estimated prevalence in the population using its existing demographic and age structure. It can be useful when describing the estimated burden of obesity within a particular county. However, crude prevalence can be influenced by differences in population age composition. Counties with different age distributions may therefore not be directly comparable using crude estimates alone.
Age-Adjusted Prevalence
Age-adjusted prevalence accounts for differences in age distribution across populations. This makes age-adjusted estimates particularly useful when comparing obesity prevalence between counties or other geographic areas whose populations may have different age structures. Age adjustment does not represent the actual proportion of residents with obesity. Instead, it provides a standardized measure designed to improve comparisons between populations.
What Does the 95% Confidence Interval Mean?
Each prevalence estimate is accompanied by a 95% confidence interval (CI), which represents statistical uncertainty surrounding the modeled estimate.
For example:
Estimated prevalence: 34.8%
95% CI: 33.6%–36.0%
The prevalence estimate is the central modeled value, while the confidence interval provides information about its precision.
Wider confidence intervals indicate greater statistical uncertainty. Small differences between counties should therefore be interpreted cautiously, particularly when their confidence intervals overlap substantially.
How Are the County Estimates Generated?
CDC PLACES uses a small area estimation approach to produce health estimates for geographic areas where directly measured survey estimates may not be sufficiently available or reliable. The methodology combines data from the Behavioral Risk Factor Surveillance System (BRFSS) with population and demographic information from the U.S. Census Bureau and the American Community Survey. CDC applies a statistical approach known as multilevel regression and poststratification (MRP) to generate estimates at geographic levels including counties, places, census tracts, and ZIP Code Tabulation Areas. For the obesity measure, the model uses information from adults aged 18 years or older whose BMI is calculated from self-reported height and weight. Model probabilities are then applied to the relevant population distribution to generate estimated prevalence for each geographic area. The resulting county values should therefore be understood as model-based small-area estimates, rather than direct measurements obtained from surveying every county independently.
References & Data Sources
- Centers for Disease Control and Prevention (CDC). PLACES: Local Data for Better Health.
- Centers for Disease Control and Prevention (CDC). PLACES Measure Definitions: Health Outcomes — Obesity Among Adults.
- Centers for Disease Control and Prevention (CDC). PLACES Methodology.
- Centers for Disease Control and Prevention (CDC). PLACES Current Release Notes.
This article was reviewed for accuracy by Dr. Bahman Akbari. The content is based on current scientific evidence and is intended for educational purposes only. It does not constitute medical advice and should not be used as a substitute for consultation with a qualified health professional.
Obesity Prevalence Data (Table)
The table provides a structured view of obesity prevalence estimates for U.S. counties and can be used to search, sort, filter, and compare geographic areas. For each county, the dataset includes the prevalence estimate together with its corresponding 95% confidence interval.
Available data include:
- County and state
- County FIPS code
- Crude obesity prevalence
- Crude 95% confidence interval
- Age-adjusted obesity prevalence
- Age-adjusted 95% confidence interval