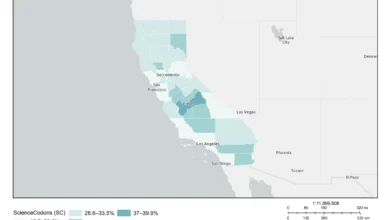
Pancreatic cancer starts in the pancreas, usually in older adults, and is diagnosed in about half a million people around the world each year, according to the International Agency for Research on Cancer. In California, county-level surveillance data from the National Cancer Institute and the Centers for Disease Control and Prevention show rates ranging from 6.2 to 15.9 new cases per 100,000 people per year across the state’s 58 counties. The California statewide rate is displayed on the interactive map. All rates are age-adjusted to the 2000 U.S. standard population, a method that applies each area’s age-specific rates to a common reference age structure so that areas with older or younger populations can be compared fairly.
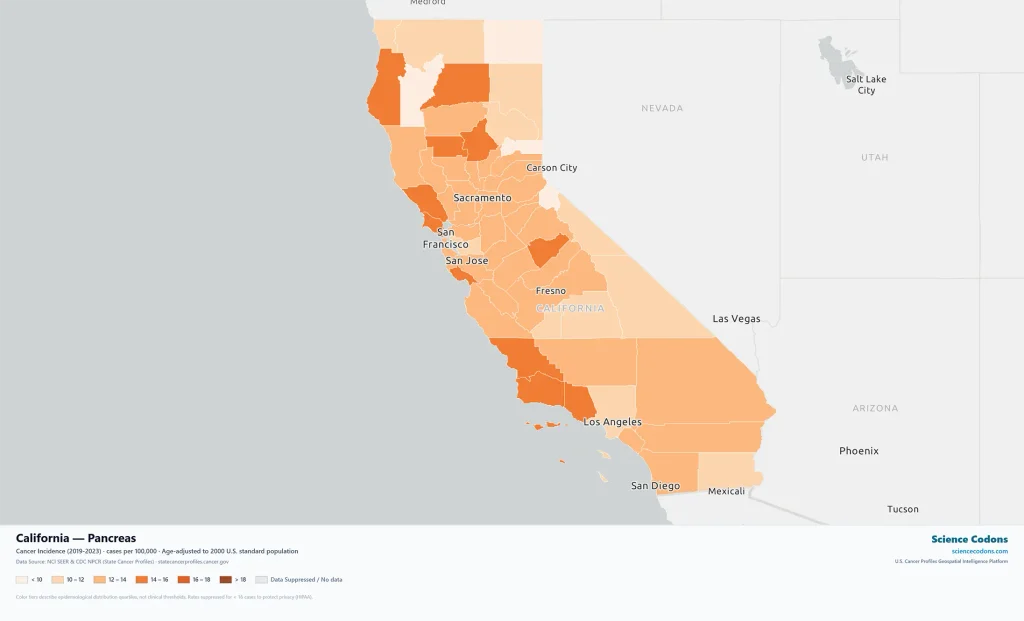
California Pancreatic Cancer Rates Compared to National Benchmarks
For the recent 5-year period, the national age-adjusted incidence rate for pancreatic cancer is 13.5 new cases per 100,000 people, with a 95% confidence interval of 13.4 to 13.6. A confidence interval is the range within which the true rate is likely to lie, and a narrower interval indicates a more precise estimate. The California statewide rate and its confidence interval are displayed on the interactive map, where they can be read directly against this national benchmark.
County-level estimates provide a complementary comparison. A county is described as statistically different from the national rate only when its 95% confidence interval excludes 13.5. By that standard, 35 of California’s 58 counties have intervals that include the national rate and are therefore not statistically different from it, 20 have intervals that lie entirely below it, and 3 have intervals that lie entirely above it. The median county estimate is 12.9 new cases per 100,000 people; this figure summarizes the counties and should not be read as the statewide rate.
Geographic Variation in Pancreatic Cancer Rates on the California County Map
The highest point estimates among California counties belong to Glenn County (15.9 per 100,000 people), Butte County (15.3), and Santa Barbara County (15.0). These are also the three counties whose intervals lie entirely above the national rate. Their intervals are wider than the median county interval, however, so the data do not support a confident ranking among them. Each is better described as above the national benchmark than as the state’s highest.
At the lower end, the smallest estimates are concentrated in sparsely populated rural-classified counties, where a small number of diagnosed cases can shift a rate substantially. Estimates from such areas are not ranked individually. Among urban-classified counties, the lowest estimates are in Imperial and Tulare counties, and both have intervals that lie entirely below the national rate.
The data show no consistent rural-urban difference in typical rates: the median of county estimates is similar in rural-classified and urban-classified counties. Rural-classified counties do show a wider spread, accounting for nine of the ten lowest estimates as well as the single highest. These patterns describe populations rather than individual risk. Smoking, excess body weight, and long-standing diabetes are associated with pancreatic cancer risk and may differ in prevalence between areas. Still, these data cannot attribute county differences to any single cause.
Recent Five-Year Pancreatic Cancer Trends in California
Trend classifications are derived from Joinpoint regression over the recent 5-year period and describe the direction of change in each county’s incidence rate. Of the 58 counties, 27 are classified as falling, 22 as stable, and 8 as rising; for one county, a trend is not available. A stable classification indicates that no clear direction of change was detected. In contrast, the national incidence rate is rising, with an average annual change of 0.8%. The California statewide trend classification is displayed on the interactive map.
Falling classifications are somewhat more common among rural-classified counties, where 12 of 21 are falling, and 7 of the 8 rising counties are urban-classified. These labels do not explain why rates are changing, and in counties with few cases a rising or falling classification can reflect year-to-year variation. Readers can examine individual county classifications and rates further on the interactive map.
Frequently Asked Questions
What is the pancreatic cancer incidence rate in California?
The California statewide age-adjusted incidence rate for the recent 5-year period is displayed on the interactive map, together with its 95% confidence interval and the national benchmark of 13.5 new cases per 100,000 people. County estimates range from 6.2 to 15.9 new cases per 100,000 people per year, with a median of county estimates of 12.9.
Which counties in California have the highest and lowest pancreatic cancer incidence rates?
The highest point estimates are in Glenn County (15.9 per 100,000 people), Butte County (15.3), and Santa Barbara County (15.0). Their confidence intervals are wider than the median county interval, so the data do not support a confident ranking among them. The lowest estimates are concentrated in sparsely populated rural-classified counties, which are not ranked individually because small populations produce less stable rates. Among urban-classified counties, Imperial County (11.2) and Tulare County (11.5) have the lowest estimates.
Are pancreatic cancer incidence rates rising or falling in California?
The statewide trend classification, based on Joinpoint regression over the recent 5-year period, is displayed on the interactive map. The national incidence rate is rising, with an average annual change of 0.8%. Among California’s 58 counties, 27 are classified as falling, 22 as stable, and 8 as rising, with a trend unavailable for one county; this county distribution describes local patterns and is not a substitute for the statewide classification.
This article was reviewed for scientific accuracy by Dr. Mosayeb Rostamian. The content is based on current evidence in epidemiology and infectious diseases and is intended for educational purposes only. It does not constitute medical advice and should not be used as a substitute for professional health consultation.